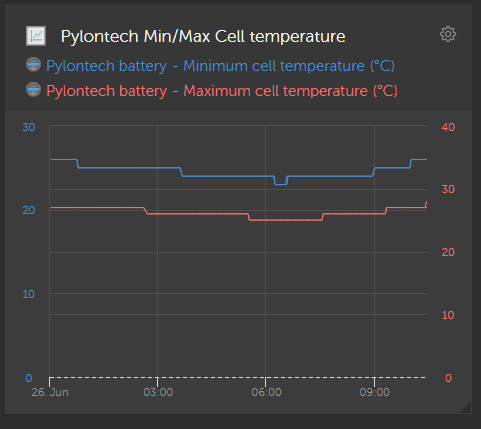
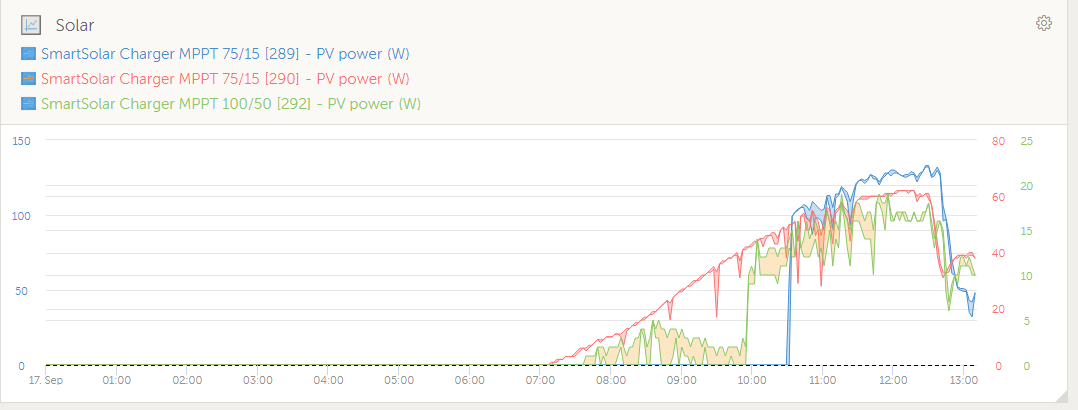
somehow the scaling on the Y-axis is always separate from the the data gathered. Example.
I pulled these two sets from my Pylontech battery. The blue one is the lower temp but is shown higher on the graph due to having a different scale. I want them to both use the same scale so the graph is in the right position relative to the upper temp.
Ditto goes for DC and AC voltages, frequencies, etc... All get their separate scaling. Is there a way to combine them?


