How long are the advanced history stats available via the VRM portal. It looks like I’m missing data older than about 6 months under the advanced reports, but have older content from the dashboard. It looks like I might need to export these on a regular basis if the historical data is purged.
- Home
- Anonymous
- Sign in
- Create
- Spaces
- Grafana
- Node-Red
- Unsupported topics
- Questions & Answers
- Modifications
- Communauté francophone
- Deutschsprachiger Bereich
- Preguntas en Español
- Explore
- Topics
- Questions
- Ideas
- Articles
- Badges
question
Hi Steve,
This is answered in the VRM FAQ:
For how long is the VRM data being stored?
You are correct, AT THIS STAGE you will need to export at least every 6 months to maintain FULL data.
I have been advocating for this, or at least some portion of it to be increased to 18 months for a couple of years now. There are so many other improvements in the pipeline though, it is not a high priority.
It would help my case if you could explain your reasons for why you want the detailed historical data for longer than 6 months.
I just discovered that the data is only stored for 1/2 year. I didn't know that and I find that very disappointing.
Please advocate to keep the data for 18 months as you suggested,
- automate the backup of the detailed data of 1 year, by sending the file to the email address of the alerts.
- make it easy to read the backup files in VRM.
thank you
Hi Guy,
There is still no way of getting hold of older data (advanced), I guess? I have made a mistake and not stored the older part of a data collection started in December last year...
Sorry @Per-Erik,
For now there is not. Improvements to this are on the way to help with this long term data situation. For example, I have discussed the ability to set up periodic, automatic download and email of data.
The VRM development team has a lot to manage, and posts like yours do help me to demonstrate that there is demand for this, when deciding the priorities.
any news on this topic?
We often set up temporary mobile solutions for solar/battery power supply. We wanted to compare the different years but noticed the data was gone :(
If the 6 months stays, then indeed an automatic periodic export would come in handy.
Thanks
The dashboard consumption and production data is kept for 5 years.
It would be great to compare the MPPT (I've three different MPPT in total) and I want to be able to compare each separate MPPT e.g. year by year or months by months.
At the moment I didn't have any solution how to compare the years. The MPPT itself writes only the last 30 days and total. In VRM I can see 6 months but I'm not able to compare April 2022 with April 2023. It's only possible to compare the whole PV production. In my case I've 3 MPPT + AC inverter + 2 x micro inverter.
Interestingly enough, the battery status does have a little more info than other reports. I wanted to be able track my historical usage in order to make better decisions on my configuration and future expansion, and in order.to do that I need to look at trends over all 4 seasons (18 months allows me to do this and would be a great timeframe). Today, I was trying to capture a span of time in June when I was traveling a l T, and I wanted to analyze my solar while traveling vs. solar while in one place. Now I can’t do that....
Here is an extract from some of my thoughts on how to balance data use vs long term functionality and how it could be improved.
Please have a read and let me know if that would satisfy your use case, or any other thoughts or suggestions. I am confident we can improve this.
# Daily Summary Data
The following metrics are only required at a daily resolution (24 hour midnight to midnight).
But they should be held indefinitely for the life of the system. Not all will be available for all configurations.
| battery V minimum |
| battery V maximum |
| battery V average |
| total kwh generated |
| total kwh consumed |
| soc maximum |
| soc minimum |
| soc average |
| time to go |
| time in bulk |
| time in abs |
| time in float |
| time in equalisation |
| pv power maximum |
| pv energy |
| temperature C minimum |
| temperature C maximum |
| temperature C average |
| midpoint battery voltage variation |
| AC input V minimum |
| AC input V maximum |
| AC input Watt maximum |
| AC input kWh |
| Genset operating hours |
As these are different in layout to the normal data collected in the VRM, it would make sense to display them in a different section.
Currently the VRM is separated into Summary Data, which includes kWh in and Out for the indefinite life of the system. Other, higher resolution but shorter terms data is available in the “Advanced” menu.
A new “Daily Overview” area perhaps.
This daily overview data would be extremely useful for a technician to quickly review system performance, where the current ‘Advanced’ data is extremely detailed, it can be more difficult to extract the most relevant system performance information at a glance in one spot.
Some calculated figures could be good like average daily kWh out of the battery over a month or so. This would give a view of how much the user is pulling from the battery per night on average.
Two thoughts.
1) I would also like to see the current granularity stored for 12 months instead of 6. This would allow me to analyze history throughout all 4 seasons as the year change.
2) the daily data you mention above that could be stored indefinitely, appears to be missing any solar data I might like to also analyze the solar performance.
@Steve Mullins Thank you for preempting my question.
@Guy Stewart (Victron Community Manager) In addition to the practical reasons for using VRM data older than six months. Please consider your audience, we are all a little nerdy and many of us love/value our data. Exporting is fair (as its a free service) but if you give us a data platform for life (i.e. unlimited data), then you have my business for life too. If you need me to pay for a "premium cloud service" then you can have my money.
I would love to chat more about this with you and your team.
Hi @dalewright,
I can say for sure this has been deeply considered from many perspectives. I was also convinced and have been in those shoes, banging on that drum, and thinking about this problem over 3 years ago now and again a couple of years ago.
Firstly over groups, then via email, then via phonecall and finally face to face. I have not given up, to the point that I am now inside the house working for Victron so I can help drive the changes I want to see (this community being another one).
@mvader (Victron Energy Staff) must surely be a little tired of talking to me about this specific VRM data retention at scale topic, and through his patience, my own thinking has changed somewhat.
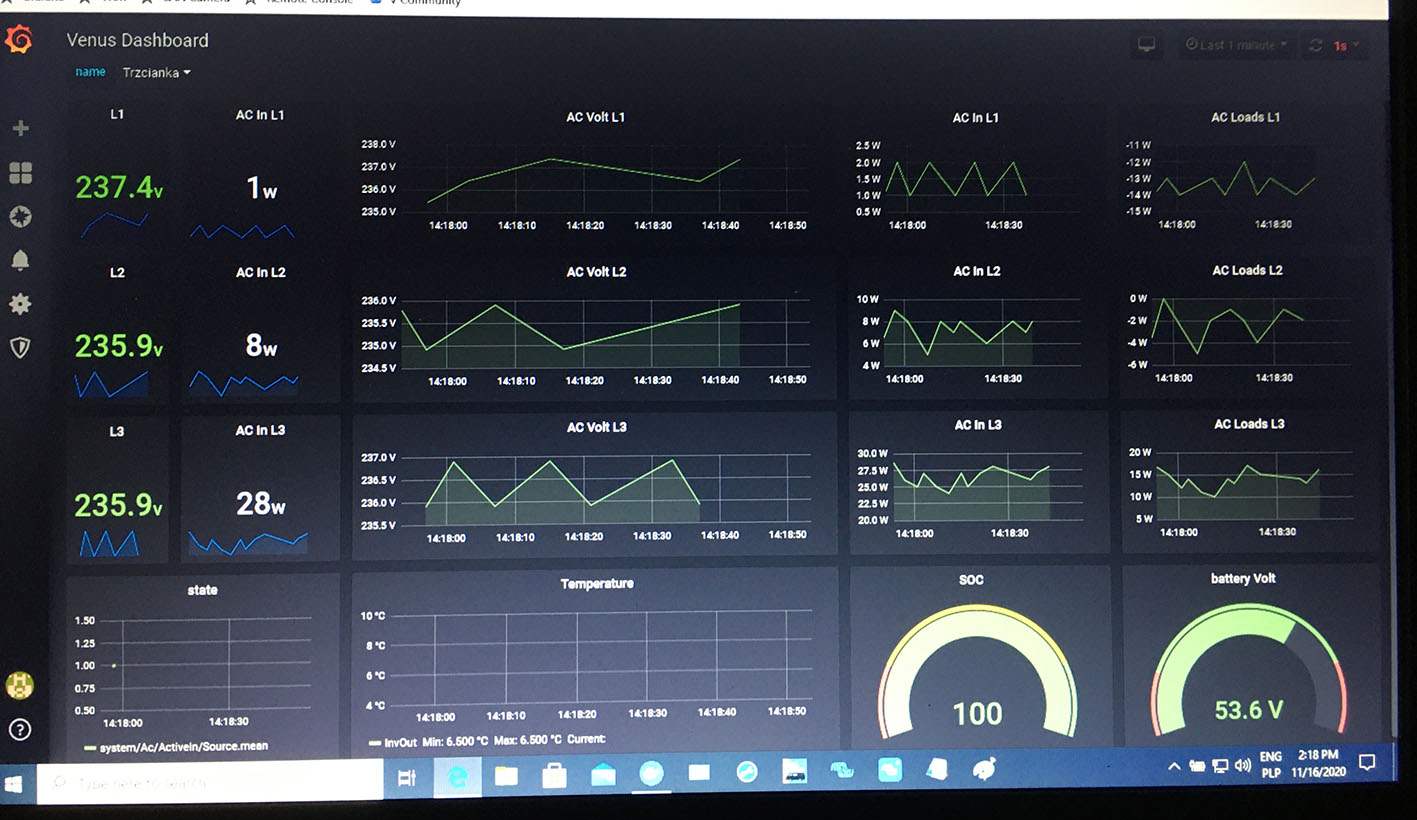
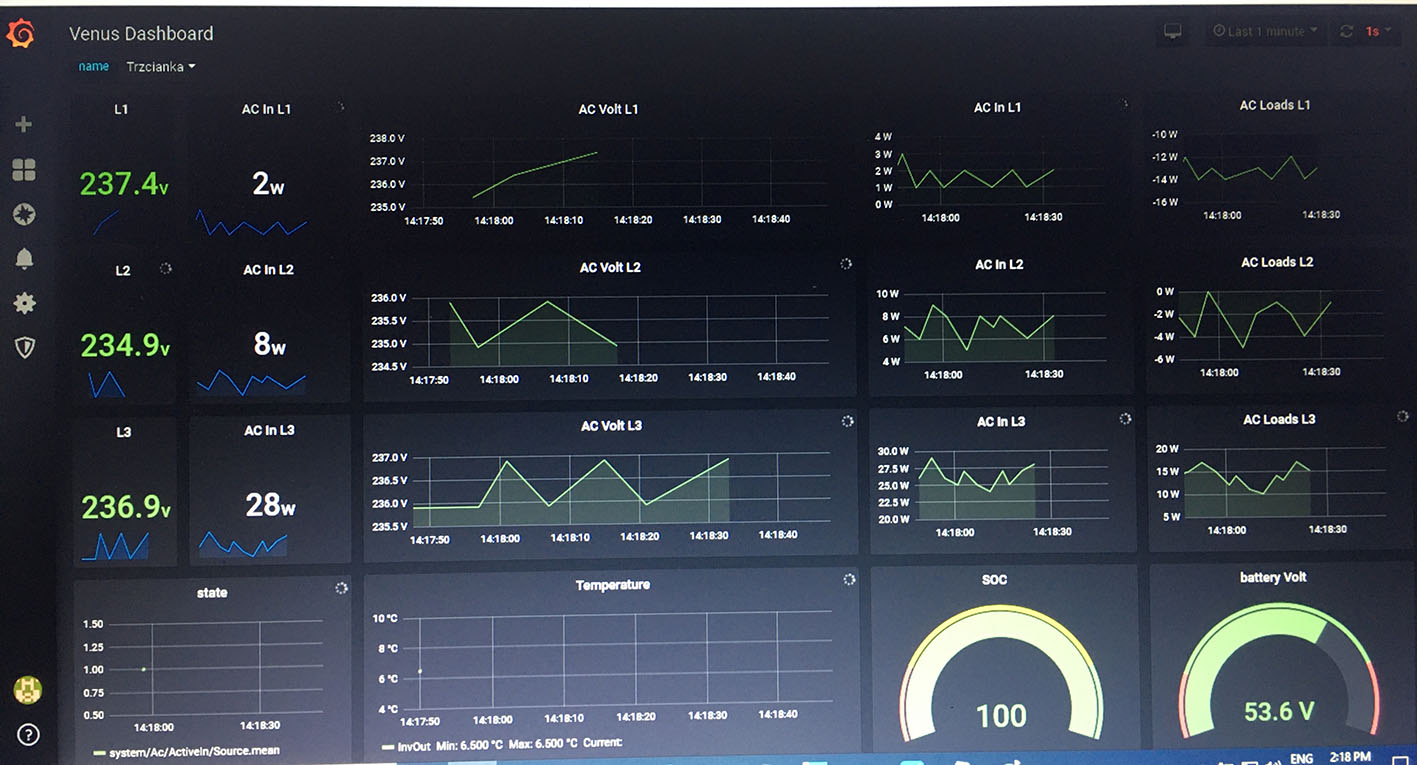
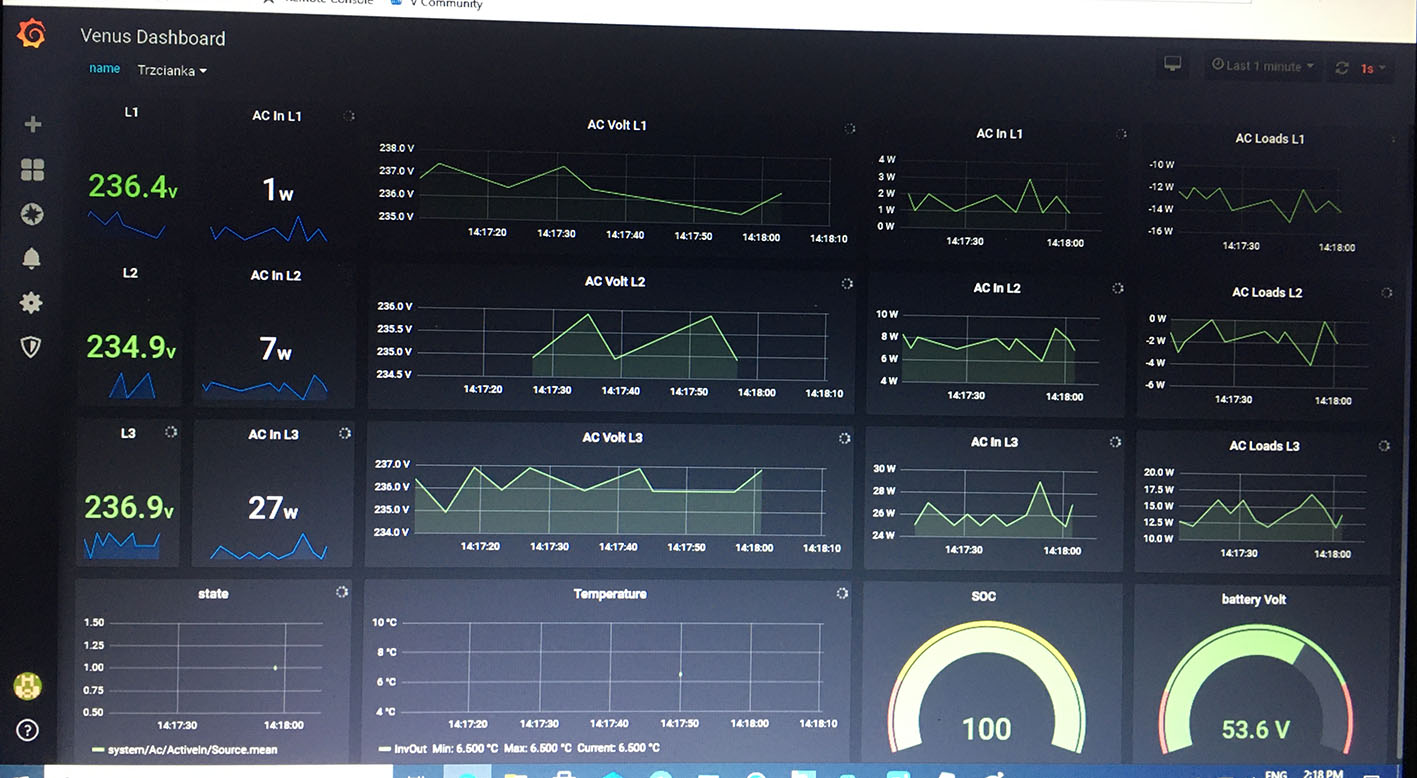
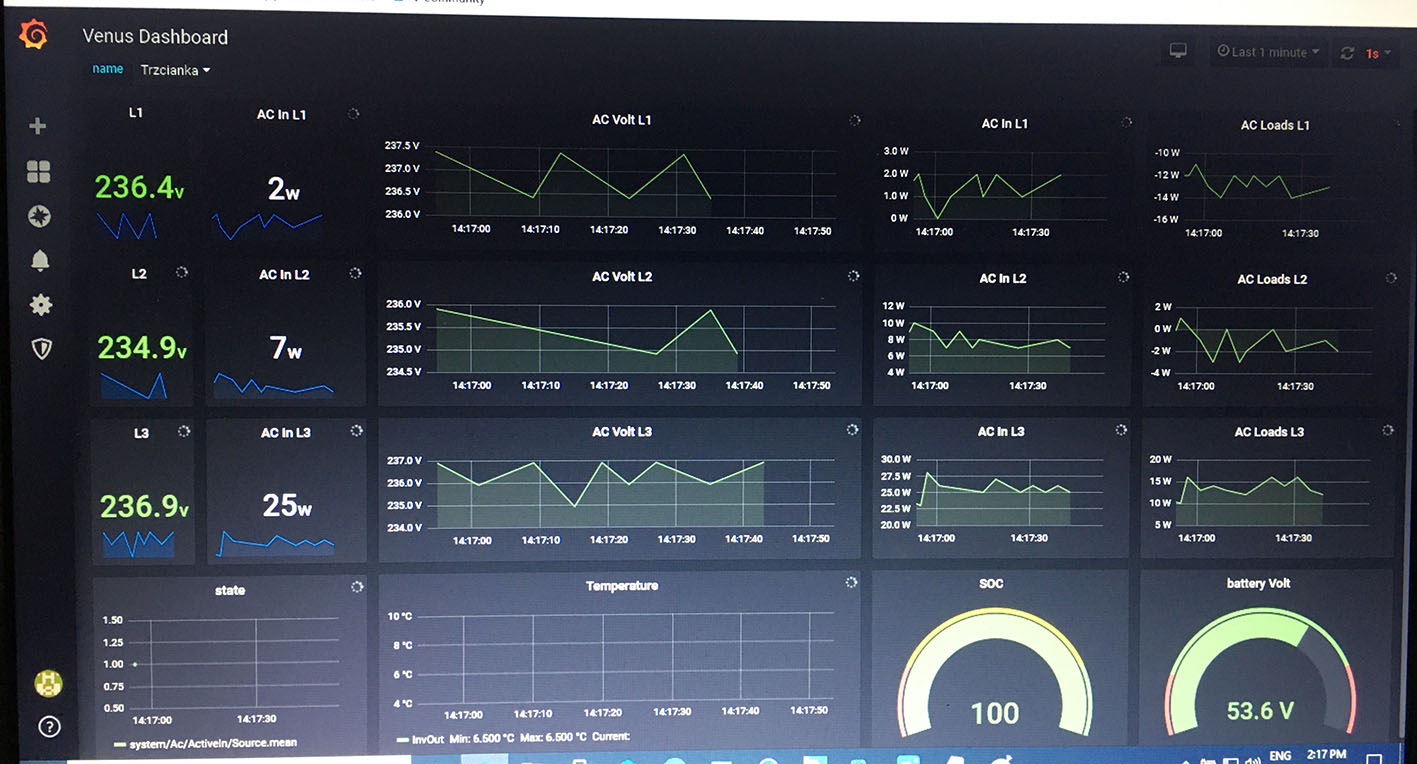
For one, we now also have an EXCELLENT alternative to VRM available via MQTT and Grafana for those data nerds who want not just long term data, but also very high resolution (per second). With extremely customisable dashboards that are able to be perfectly tuned to your systems data, and your desired displayed parameters. It is also free, though you must supply your own computing and storage resources.
Rather than have VRM do everything, at Victron scale of many 10,000's of simultaneous systems into our portal, grafana can be more tailored, more flexible and more enduring for those that require that.
It becomes a much more challenging design for Victron to satisfy the data nerds and also the non-technical end user with the exact same platform. So better to give the nerds a free reign, and their own data ownership.
The documentation for Victron Grafana is in need of some help, but many have it working with what is already there.
Hey @Guy Stewart (Victron Community Manager)
Thank you so much for your advocacy!
Spinning up my own InfluxDB and Graphana was fun (I played with it for a while) but I really want experts (you) to take care of my data.
Will you consider taking my money?
Thanks again
Purely as a thought exercise (as there are no plans that I know to enable such a function, or even platform to take a payment);
What would such a service be worth to you, and what are the specific features or level of additional support you would be looking for?
It is important to know that the limitations of this kind of development at Victron are not mainly financial. They are focus, priority, quality, vision, programming/UX/project talent, co-ordination, reliability, integration, and so on.
Additional ongoing expenses do need a supportive business model and sufficient customer demand, but just having an income stream opportunity is not necessarily enough to move it to the top of the list.
This "per second" resolution you are talking about is a myth. The best one can hope to get is a sample every 10 seconds.
https://community.victronenergy.com/questions/53696/grafana-refresh-rate-10-seconds.html
It's a bit more nuanced than that.
It's easy to conflate sample rate, refresh rate, resolution, display delay, and accuracy, depending on what you are looking for.
Given the official status as 'unsupported, on-your-own-time, at-your-own-risk, side project', it might take a while - but I have at least started a new article here that I intend to improve with further explanations as I get the chance and learn more myself.
I understand the idea that this is unsupported method of gathering data from Victron unit. My first attempt on getting this 1 second resolution failed.
Changing the group(10s) to group(1s) did not achieve the 1 second resolution.
At best it is 3 per 10s.
On top of it, there is long delay (sometimes 30s) in displaying the graph.
The delay would not be a problem but it is not only a delay in displaying this data, but data itself is missing in this delayed period.


I want to second that I would gladly give you my money to store my data long-term. I did not realize it was only for 6-months on VRM and now I'm scrambling to export data. I want to track my power generation/usage overtime.
Though I do appreciate the ability to store the data myself with MQTT and Grafana, at some level I don't always want to setup my own system.
Please, take my money!!
**Update**
I hadn't realized VRM only stored 6-mo worth of data. I'm really sad that I lost the first half of the year as now I can't compare generation/usage performance for the full year. Of course I can start exporting data every month but that means I'll have to build my own graphs. I'd really love to pay a little extra for Victron to keep that data for a much longer period so that it can be graphed.
Data is cheap to store and Victron has already done the work of capturing and displaying it (which is expensive from a development perspective). You should leverage that work and have a premium option to see 5-years worth of data. I'd pay extra for that.
Hi @hummingbear
You do know that consumption and generation data -is- kept?
https://www.victronenergy.com/live/vrm_portal:faq#for_how_long_is_the_data_being_stored
For how long is the data being stored?
The data shown in the advanced tab is being stored for at least 6 months, with exception of Battery state of charge.
The data used to show the solar yield and the consumption tab (kWh data) is stored 5 years minimum.
Hello to all.
I checked VRM and even quite some time later there are still only 6 month of data. In my opinion within end of 2022 and the option "this year" i would expect to have the date at least for this time rage available. In my opinion for comparions reasons i would like to have it a couple years. I prepare regulary presentations where i present emergency power presentation and it would be superb.
Try specifying the dates.
Are the storage limitations the same for GlobalLink 520 systems ? They have far less amount of data due to the four samples pr hour, so perhaps longer period ? Also the dashboard data is useless when there are two smartshunts in the system as it mixes data from those two.
-Goffen
Related Resources
Additional resources still need to be added for this topic
question details
20 People are following this question.
