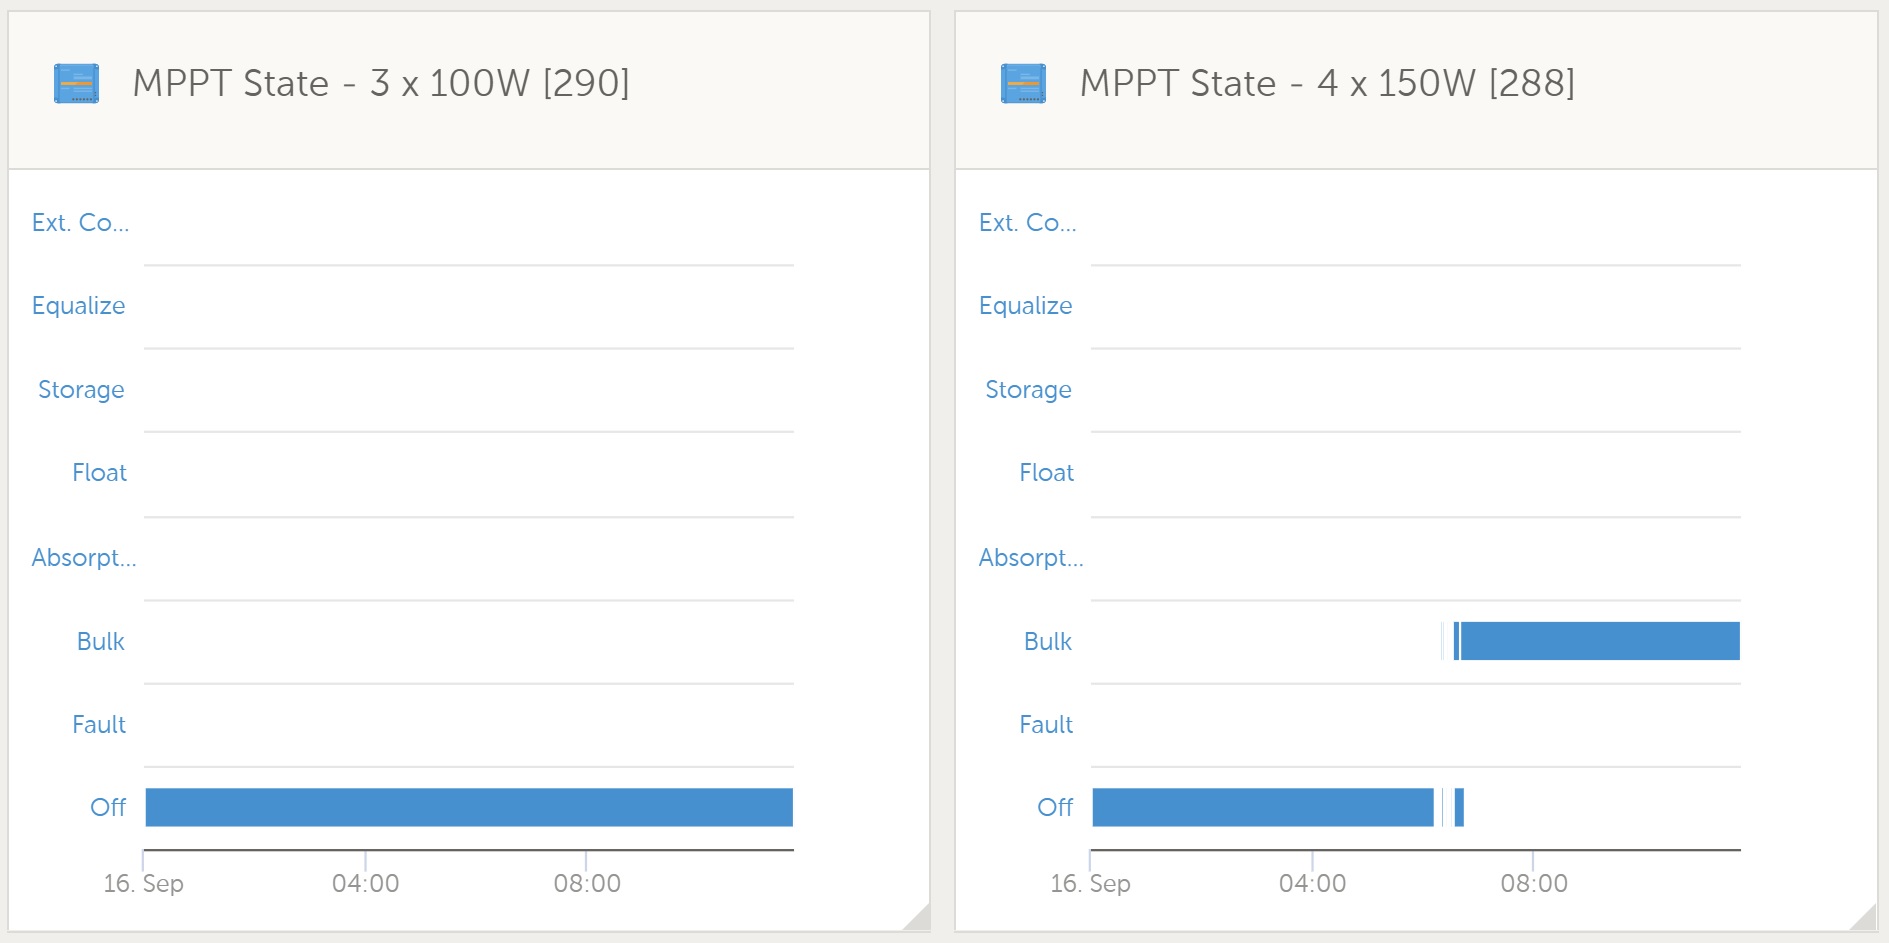
 Today display
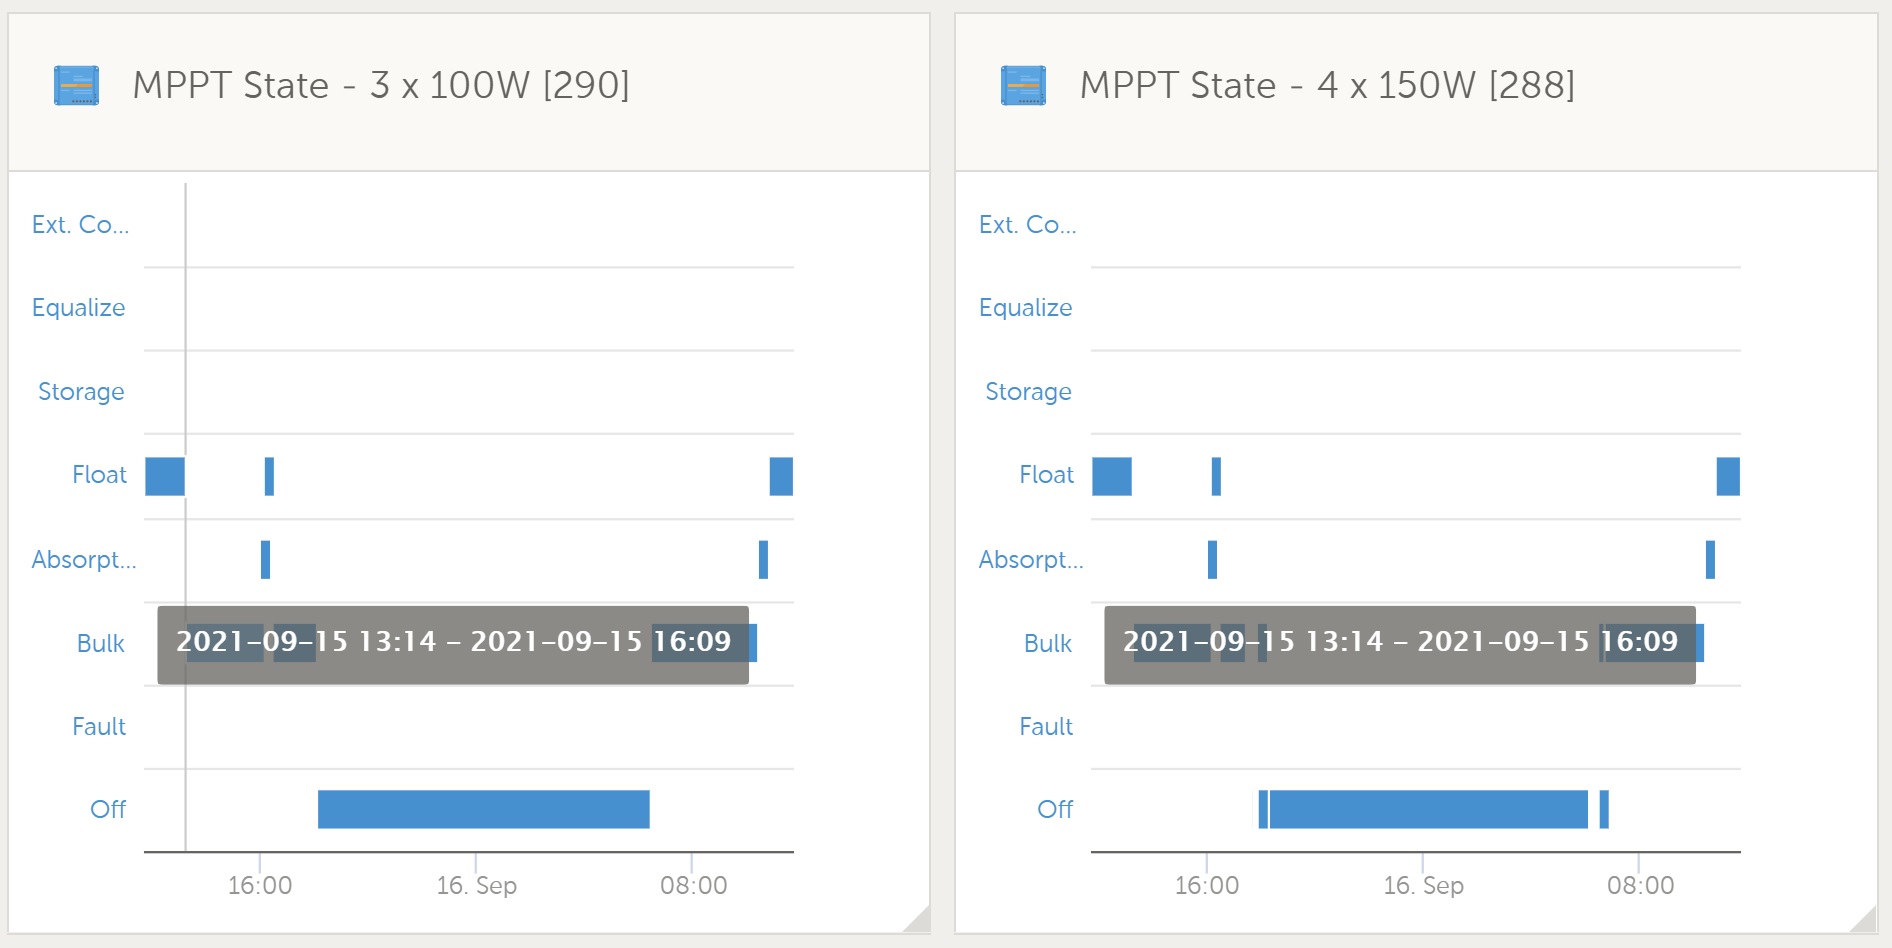
 Last 24 hours
As you can see, the last 24 hours shows charge yesterday and today and reaching float on both days. The Today shows on charger not charging today and the other not getting past bulk.
This site is now in read-only archive mode. Please move all discussion, and create a new account at the new Victron Community site.
 Today display
 Last 24 hours
As you can see, the last 24 hours shows charge yesterday and today and reaching float on both days. The Today shows on charger not charging today and the other not getting past bulk.
https://community.victronenergy.com/questions/101893/vrm-bug-in-advanced.html
There have been a number of posts on this, but thank you for contributing. With all the VRM upgrades this one snuck in.
Thanks for your reply.
Thank you for reporting this. The issue should be fixed by now. It was a grouping problem in the state widgets introduced recently.
Hi. Has this issue been fixed
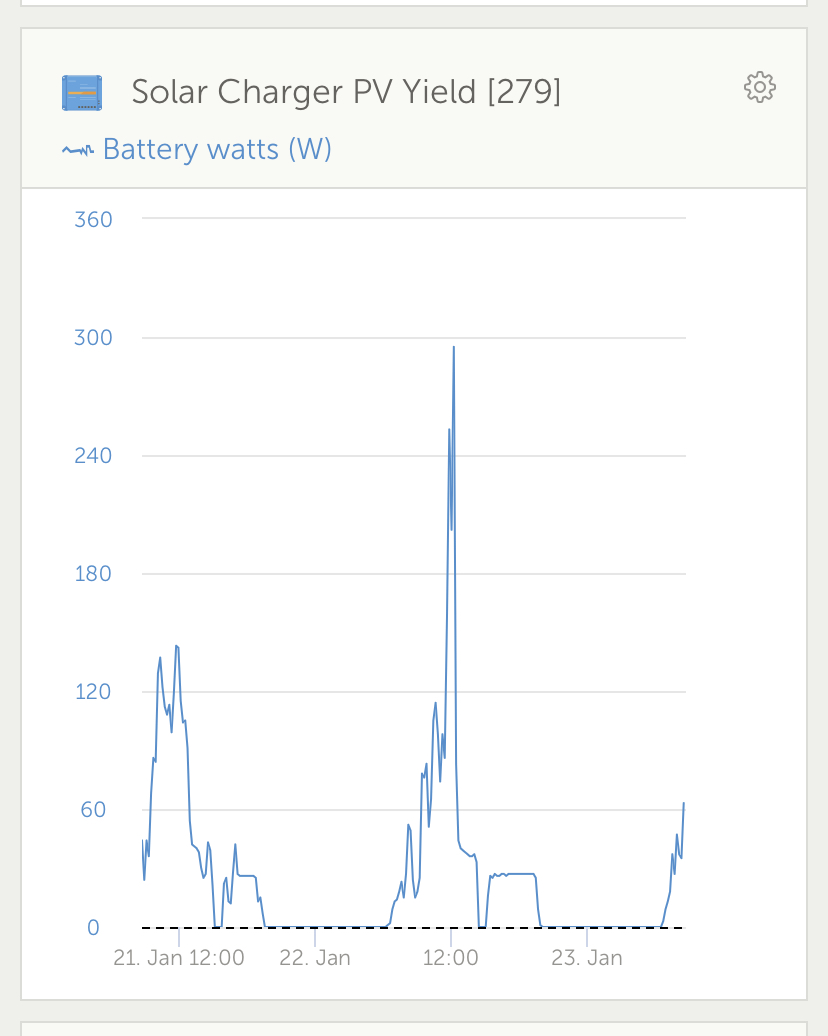
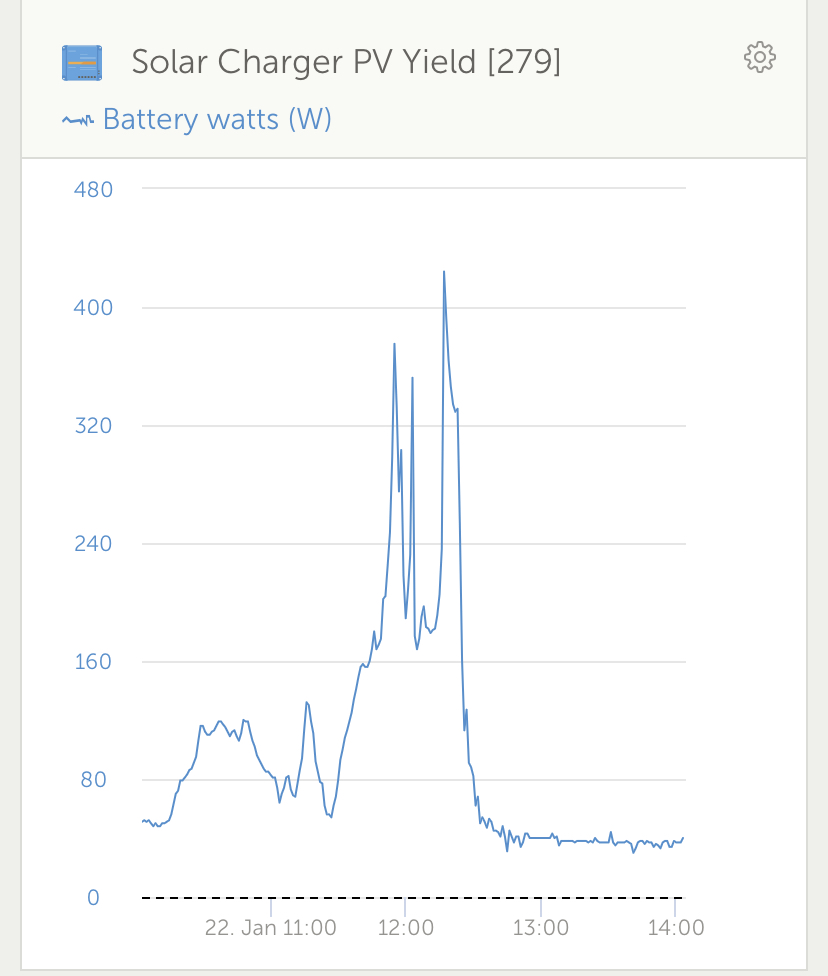
When I look at the data on VRM for the previous day it shows a peak of around 300 watts but when you zoom in it shows it to be round 425 Image Caption

Scenario 1: steady sun, readings are 100 90 100 110 100 100, average is 100, peak 110, min 90
Scenario 2:dark cloud passes over, readings are 100 90 100 60 100 100,, average is 92, peak 100, min 60. On a low Res graph like this the points blend and instead of getting a single point at the average of 100, you get points at 60 and 100, which gives a vague fat line unless you really enlarge the graph.
Precise solar peaks are great for checking if your panels deliver their rated output at some point. But most of the time it's more useful to have average values. Especially on small graphs.
Additional resources still need to be added for this topic
28 People are following this question.